
|
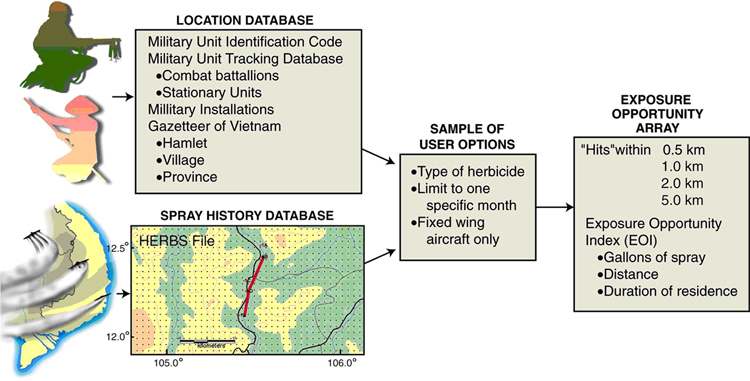
Figure 1: A schematic representation of our Geographic Information System (click to enlarge) |
The Geographic Information System, or GIS is a database that contains many layers (tables) of geospatial data. The GIS divides the land area of South Vietnam at 0.01° intervals, which we call grid points, and each data layer is then keyed to this grid system. Figure 1 shows a schematic representation of this process.
|
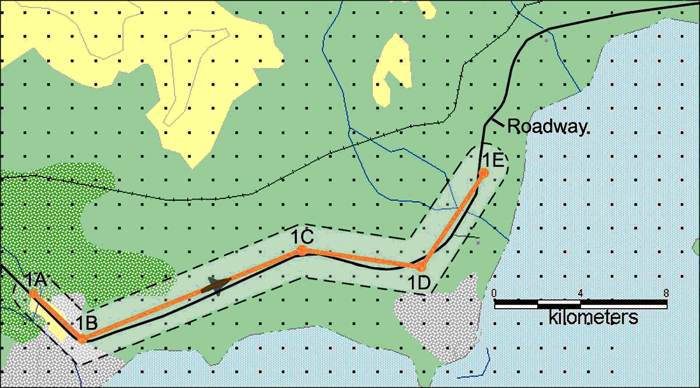
Figure 2: A typical Ranch Hand flight path (click to enlarge) |
Figure 2 shows how a typical spray flight mission is translated into the grid system by identifying every grid over which the plane flew. In this example, an aircraft sprayed Agent Orange defoliant continuously along the roadway from 1A to 1B to 1C to 1D to 1E. The dashed line indicates a 1 km envelope around spray path, each dot represents the origin (southwest corner) of a grid.1 If there was a hamlet, or a military installation in the area, it would be assigned to the same grids. A total of 176,060 grids are needed to cover all of South Vietnam, the island of Phu Quoc, and sprayed areas of Laos and Cambodia. Each rectangle on the grid is 0.01° by 0.01° in latitude and longitude in size, or an area of about 0.46 square miles (1.2 km2). Grid sizes vary and not all the grids are square because of the curvature of the Earth. We chose this grid size based on the accuracy with which we can describe spray patterns, troop locations, and other geographical entities – most of these locations cannot really be described with greater precision. When we calculate exposures, however, we use a much more precise measure of longitude and latitude in our programs.
The GIS lets us rapidly calculate how far a particular location was, in time and space, from direct "hits" from spray missions and from exposures to residual herbicides that might have arisen from earlier spray missions. We can thus use the GIS to "look-up" the locations of a military unit or a hamlet or another geographic point, and relate those locations to the spray history of the grids. More technical information on the calculations is also available.2
Throughout this website you will be provided with two different measures of "exposure opportunity" to the military herbicides. Both of these measures are based on calculations that calculate the distance between a given location in Vietnam and ALL the spray missions that took place over the years. One of the measures - the "hits" score - only considers missions that occurred on a particular day. In the table shown here we have added together all the direct hits that took place for a month period. The "hits" measure is non-zero when any herbicide missions was less than 5 km from a given location. It is measured from the center of the GIS grid in which the point falls. Our computer programs allow us to go further than 5 km, but for this website, we stop at 5 km because exposures beyond 5 km are likely to have been very small.
Exposure OpportunityWe have also developed a different measure that takes into account the fact that once sprayed, the herbicide will persist in the environment for some time. We call this measure "exposure opportunity." It is calculated by figuring out how close in time and space a given location was to spraying. Exposure opportunity is not the same as a laboratory measure based on biological or ecological samples and some experts insist that only a biological standard is valid. The Institute of Medicine (IOM) Committee on Making Best Use of the Agent Orange Exposure Reconstruction Model, however, has weighed in on this issue and listed the following five-level hierarchy for exposure assessment methodologies for veterans' studies of herbicide spraying in Vietnam, each level varying in sophistication of the analysis.
Our exposure model is at the second level and our model can be combined with further spray drift modeling and further information on personal exposure situations in order to enhance its utility even more. The IOM has carefully reviewed our work on two different occasions and found it to be robust and useful for epidemiological and other studies.3
On this website, the exposure scores are based on a 30-day half life and a first-order decay - that is, the concentration is cut in half every thirty days. This is a conservative approach. We use both the distance from all preceding sprays and the time that has elapsed when we calculate the exposure opportunity score. The exposure scores are logarithmic so that going from 1 to 2 is a 10-fold increase. You can read more about these measures in the scientific background information.4,5

 | |